- the raw drivers -
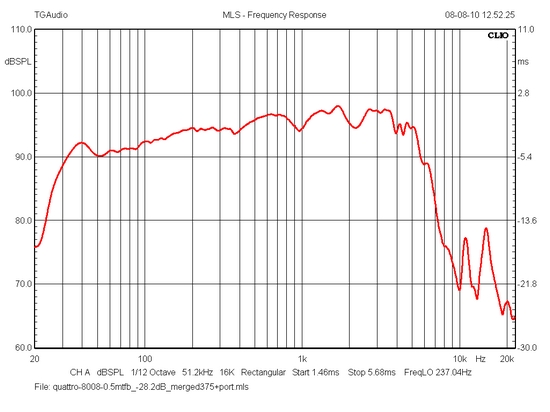 
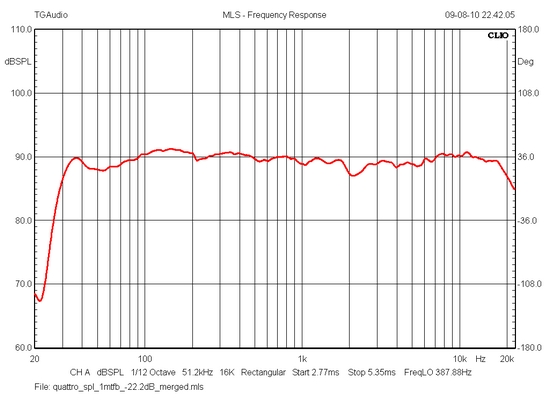
Left: Complex response of 8008 driver in
cabinet created from merging nearfield response at 375 Hz
and adding the response coming from the port. Reading
normalised for 2.8V/1 meter.
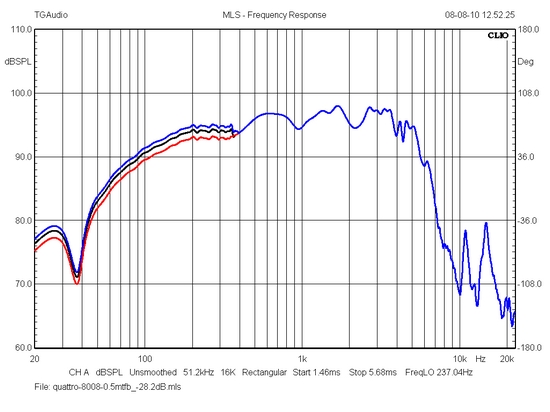
Right: 8008 response merged with nearfield response at
350 (red), 375 (black) and 400 Hz (blue). This only to
show the image to the left should be taken with a grain
of salt.
It all very much depends how we manipulate the data. The
purpose here is to get an idea of bass extension and that
the system sensitivity should be targeted in the 90-91 dB
range.
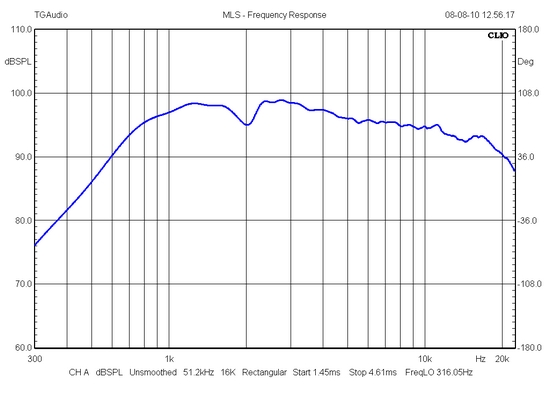 
Left: Tweeter response normalised for
2.8V/1 meter. The dip at 2 kHz can be eliminated by
modifying the tweeter, however not relevant to this
construction.
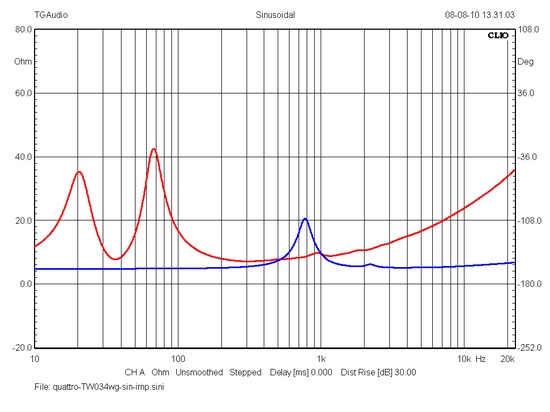
Right: Impedance of raw drivers in cabinet. No crossover
attached.
Measurements final system
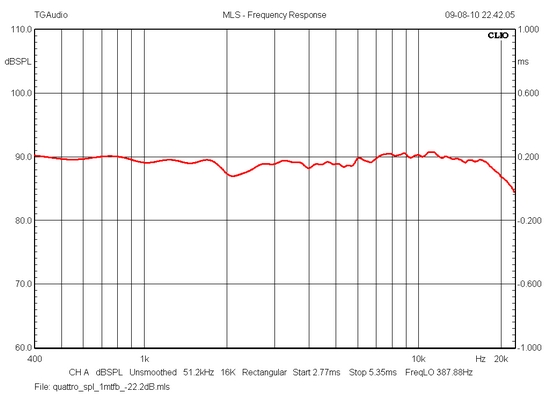 
Left: SPL at 1 meter, 2 8 volt. Overall
system sensitivity = 90 dB/2.8V/1 m.
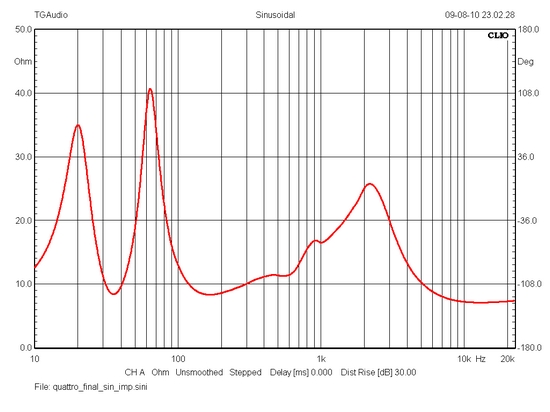
Right: Final system impedance. Minimum where is matters
is 8.3 ohms at 36 Hz and 160 Hz. 7 ohms minimum above 7
kHz.
Left: Complex response of 8008 driver in
cabinet created from merging nearfield response at 375 Hz
and adding the response coming from the port. Reading
normalised for 2.8V/1 meter.
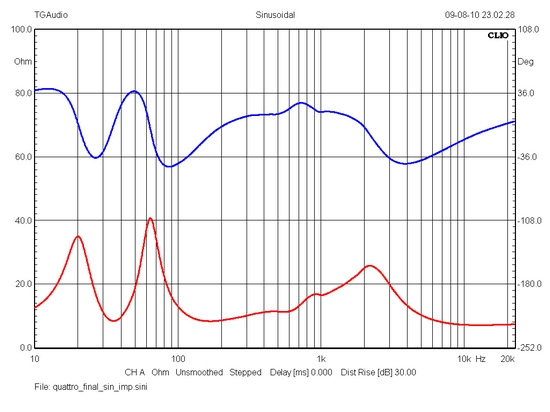
Right: Final system impedance including electrical phase.
Considering the general high impedance and modest phase
angles, this is an easy speaker on the amp.
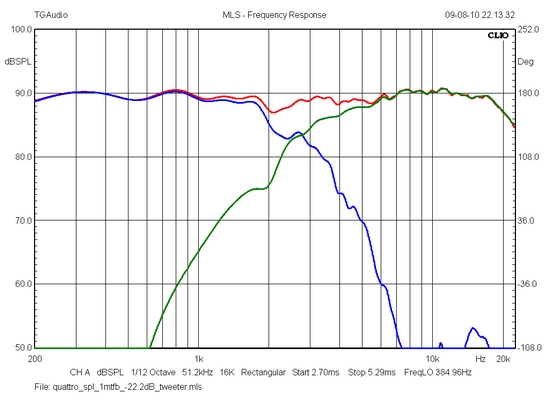 
Left: SPL from drivers driven from
crossover and summed response. Point of crossover is
around 2600 Hz.
Right: Horizontal dispersion of speaker at 0, 10, 20 and
30 deg.
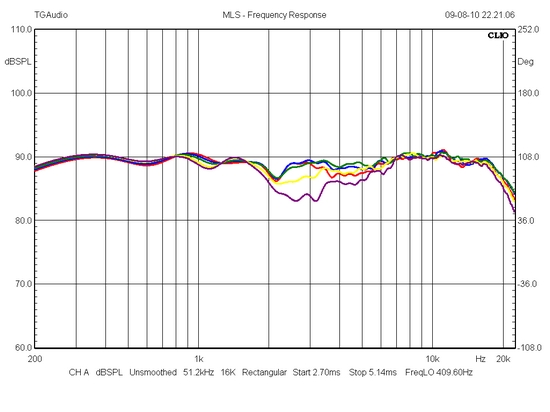 
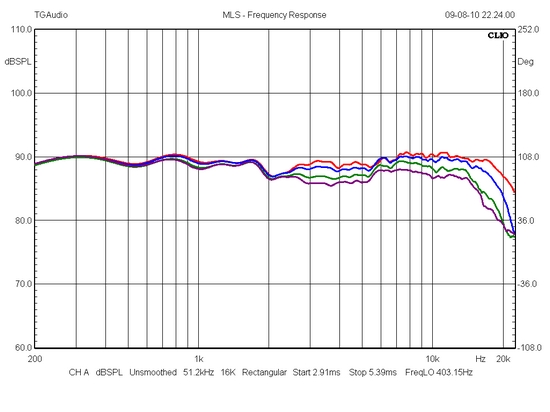
Left: Vertical dispersion measured at 1
meter distance at 0 (red), +5 (blue), +10 (green), -5
(yellow) and -10 (purple). 0 deg is right between tweeter
and woofer.
Right: Tweeter attenuation always has to be adjusted to
personal taste, room, equipment, etc. Here from R1011 =
3R9 (red), 4R7 (blue) and 5R6 (green). My preference is
5R6.
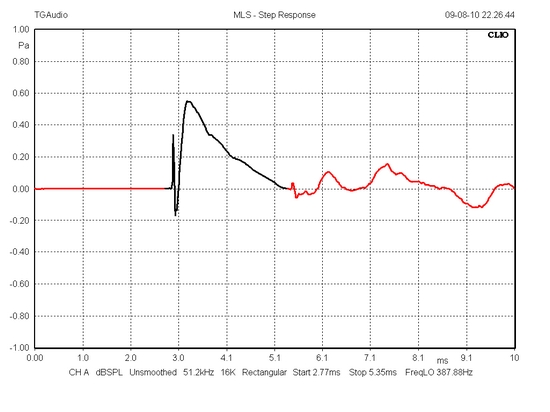 
Left: Step response of final system.
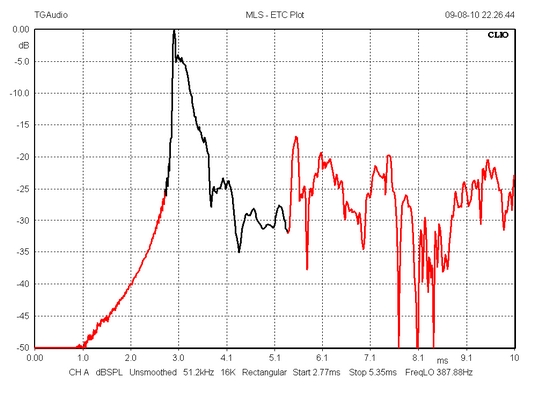
Right: ETC plot - if interested.
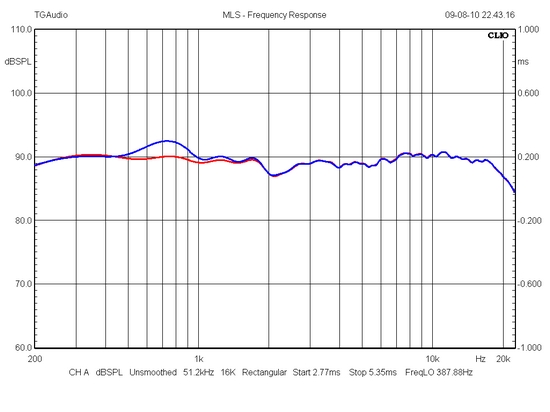 
Left: Impact of midrange notch filter. As
can be seen it flattens the response in a narrow range
between 500 and 900 Hz. Leaving out the notch filter will
produce a tremendous
midrange projection, quite appealing on some recordings,
but on certain recordings, we start listening to the 8008
driver rather than the music. A bit too much.
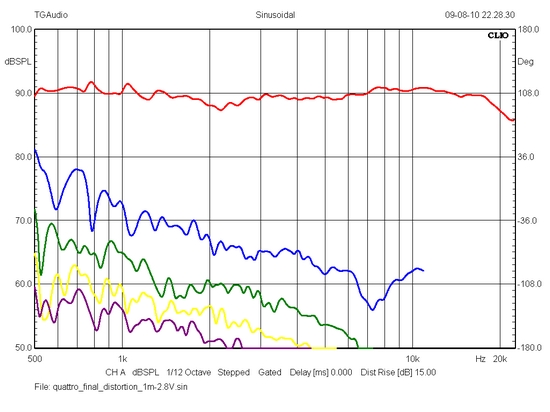
Right: Distortion measured at 1 meter, 2.8V. Distortion
lines are raised 15 dB.
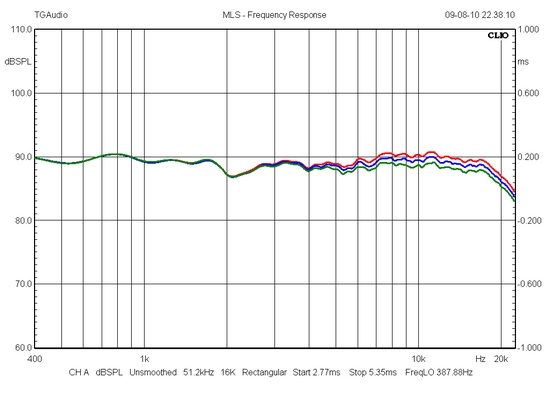
Left: Distortion as above shown in percent total harmonic
distortion (THD). Right: Same thing thing only 10% scaling.
Red is 2.8 volts and blue is 5.6 volts equivalent to 90 dB and 93 dB @
1 meter.
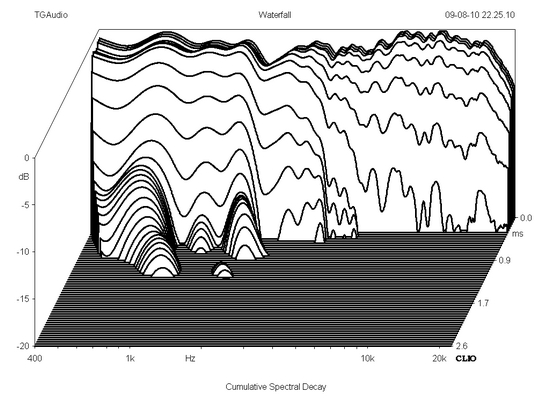 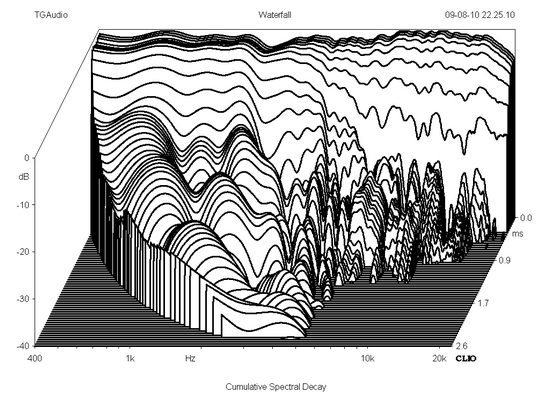
Left: Final system CSD at 20 dB scaling.
Right: Final system CSD at 40 dB scaling.
Step response of tweeter (blue) and woofer
(red) respectively.
Measurement done at 1 meter distance with the microphone
at a position between tweeter and woofer.
|