DIY Loudspeakers: HOME INDEX UPDATES RESPONSE WHAT'S NEW
Discontinued, now
open kit.
Buy components locally.
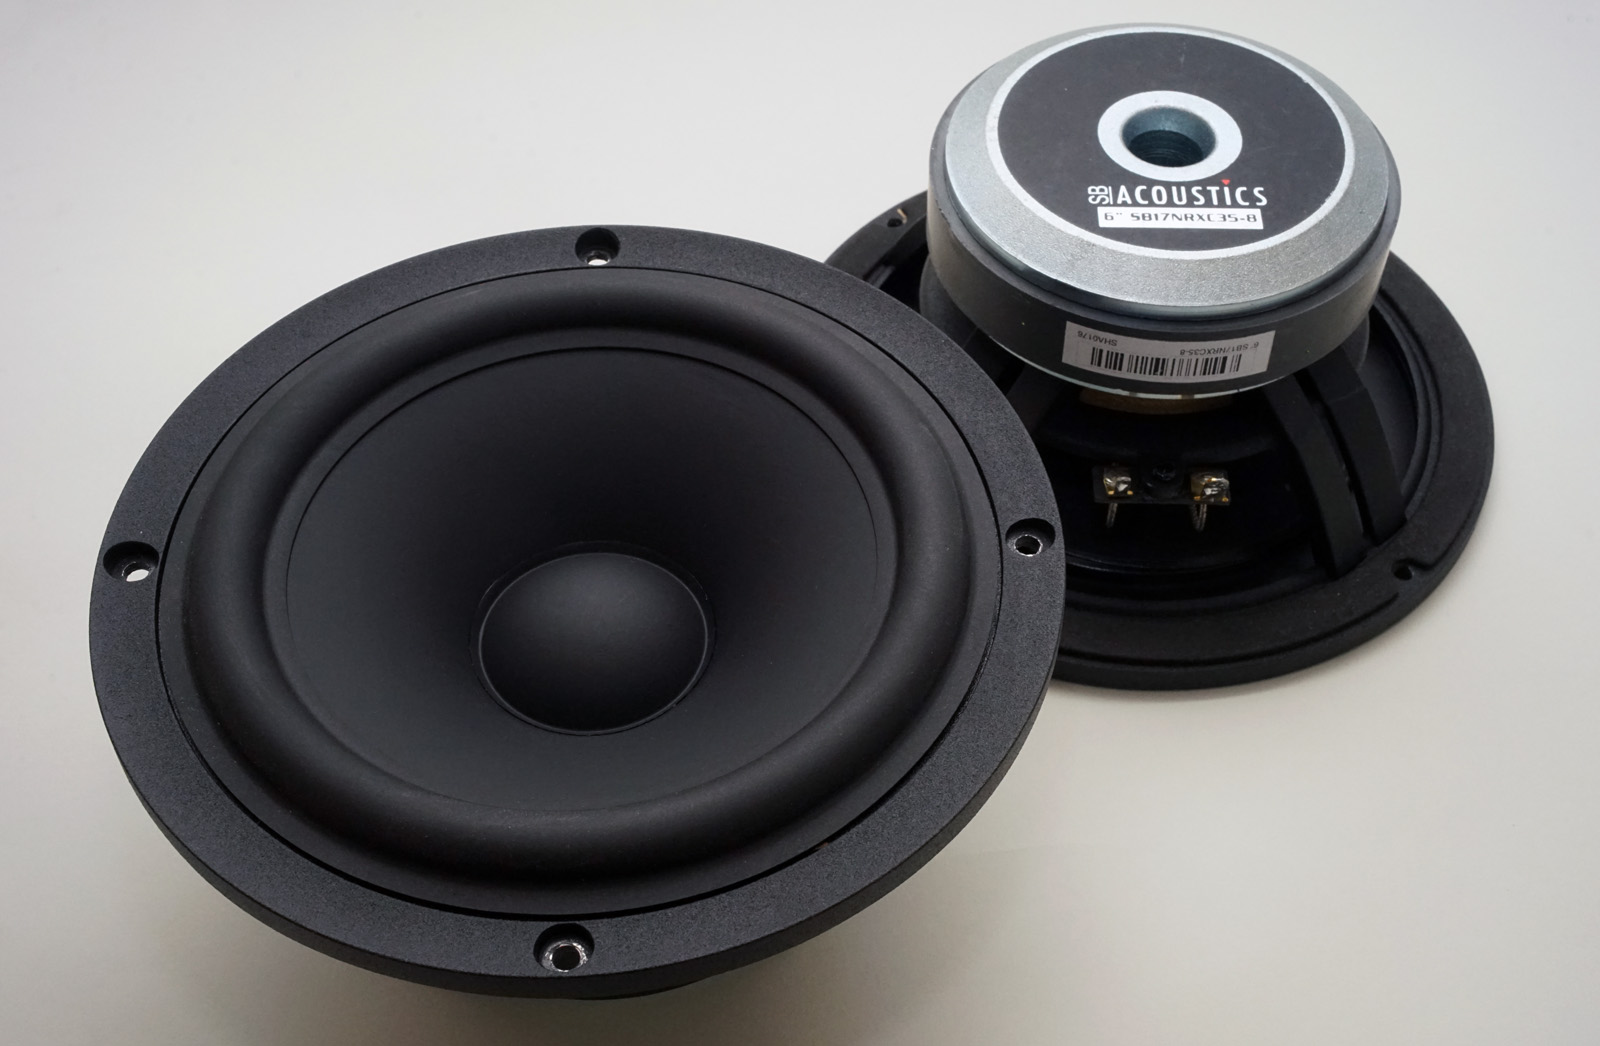
SBAcoustics 61-NRXC
Copyright 2016 © Troels Gravesen
Go to on this page:
DRIVERS
CROSSOVER
CABINET
MEASUREMENTS
CROSSOVER LAYOUT
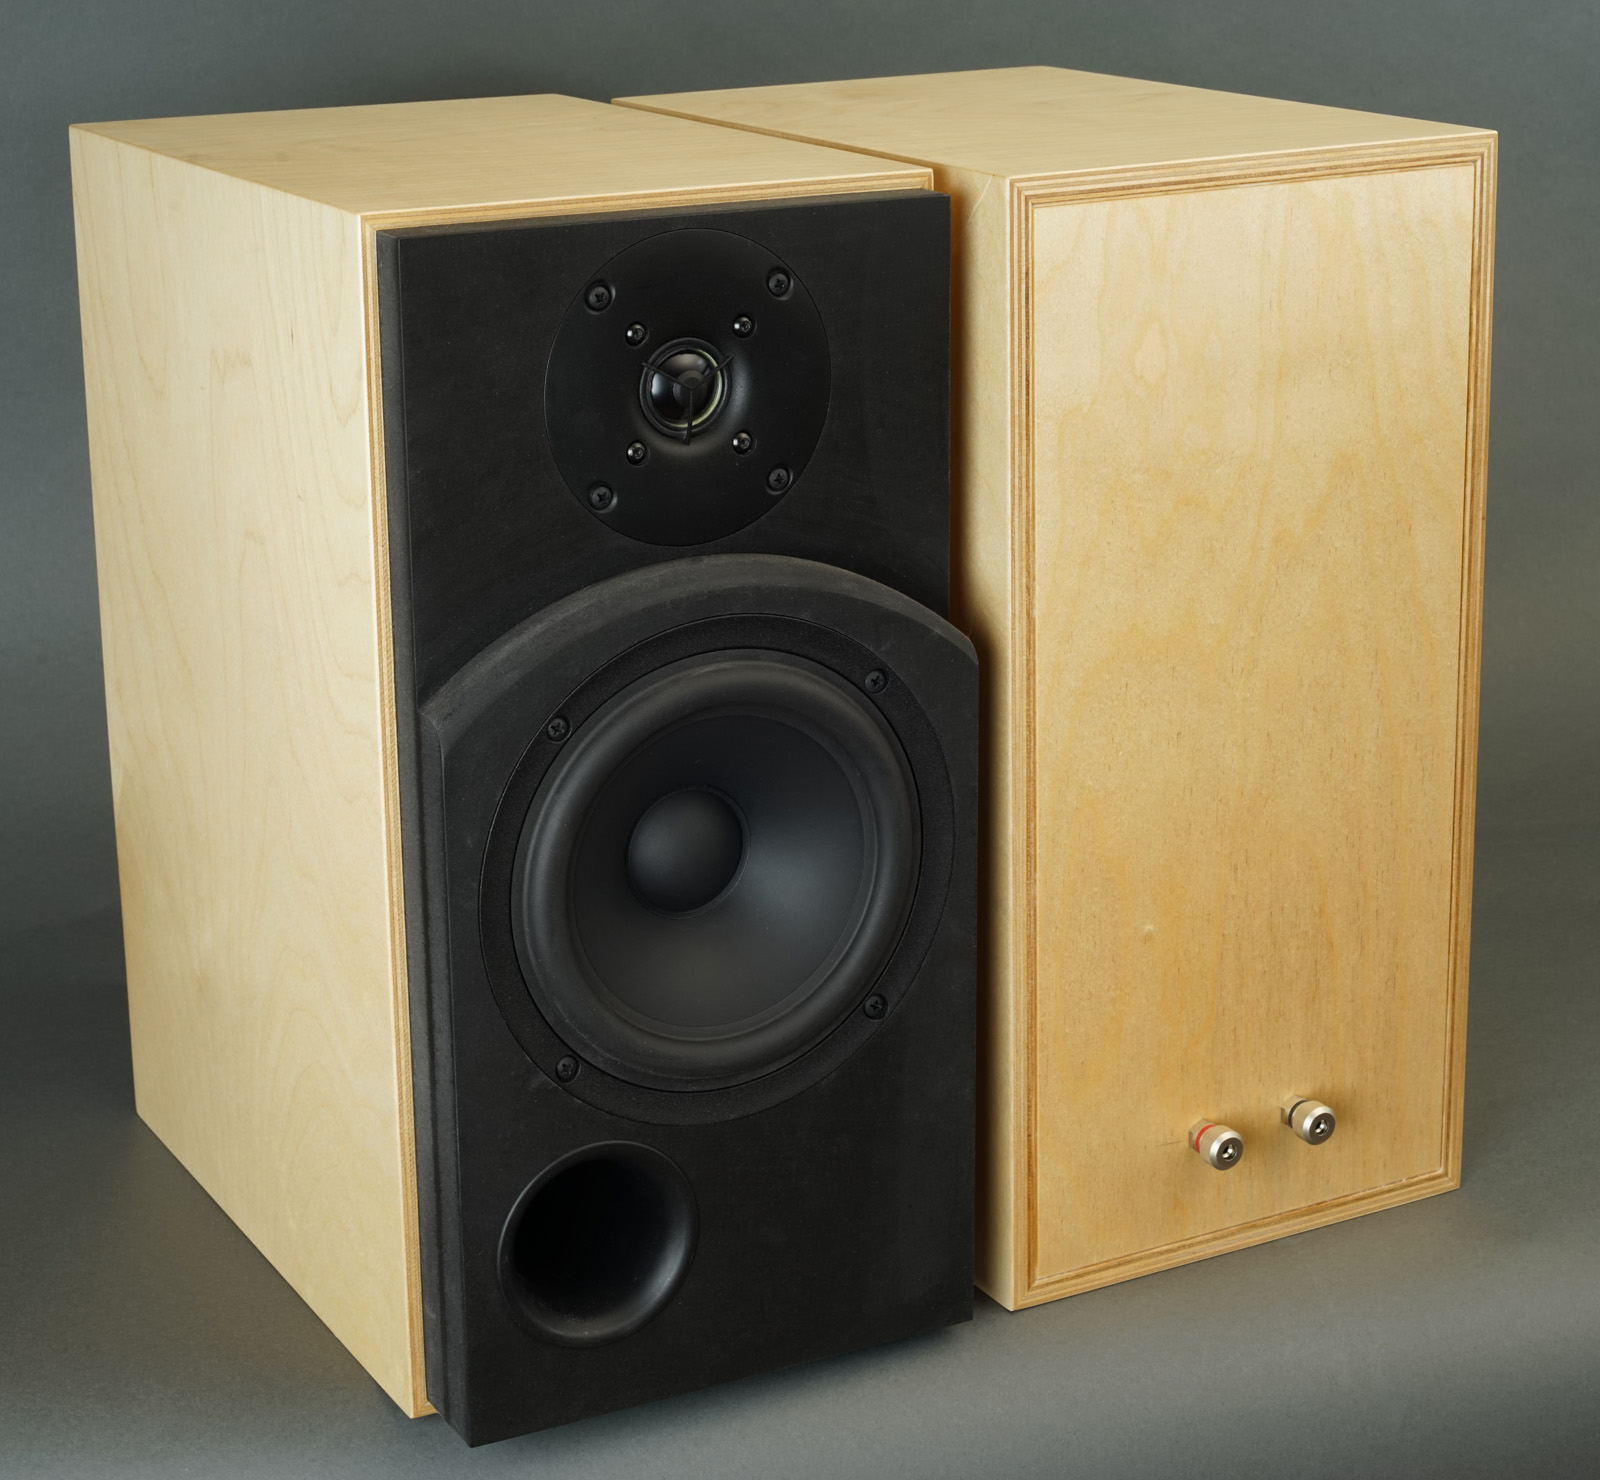
Here the final SBA-61 construction. The SBAcoustics SB17NRXC35-8 driver
obviously fit right into the cabinet used for the two other
constructions.
Hard pressed paper cones offer very much the same level
of transparency as other hard cones. They also share the same cone
break-up at higher frequences like aluminium, hence must be treated
accordingly, i.e. 4th order filters. Only a few changes from the 61-NAC
crossover had to be made. As can be seen below, a fairly straight forward
LR4, 4th order filter.
The primary thing that characterise these three speakers is the
crossover topology. Thoughts on the difference in sound from LR2 and LR4
filters can be found
here.
Secondly the cone material adds to the particular sound of a speaker and
I won't even try to add words to what it means, it must be experienced.
I've had quite a few visitors being very surprised by the smooth sound
of the 61-NAC. Not what they expected. So, three different cone
materials, take your pick!

Click images to view large
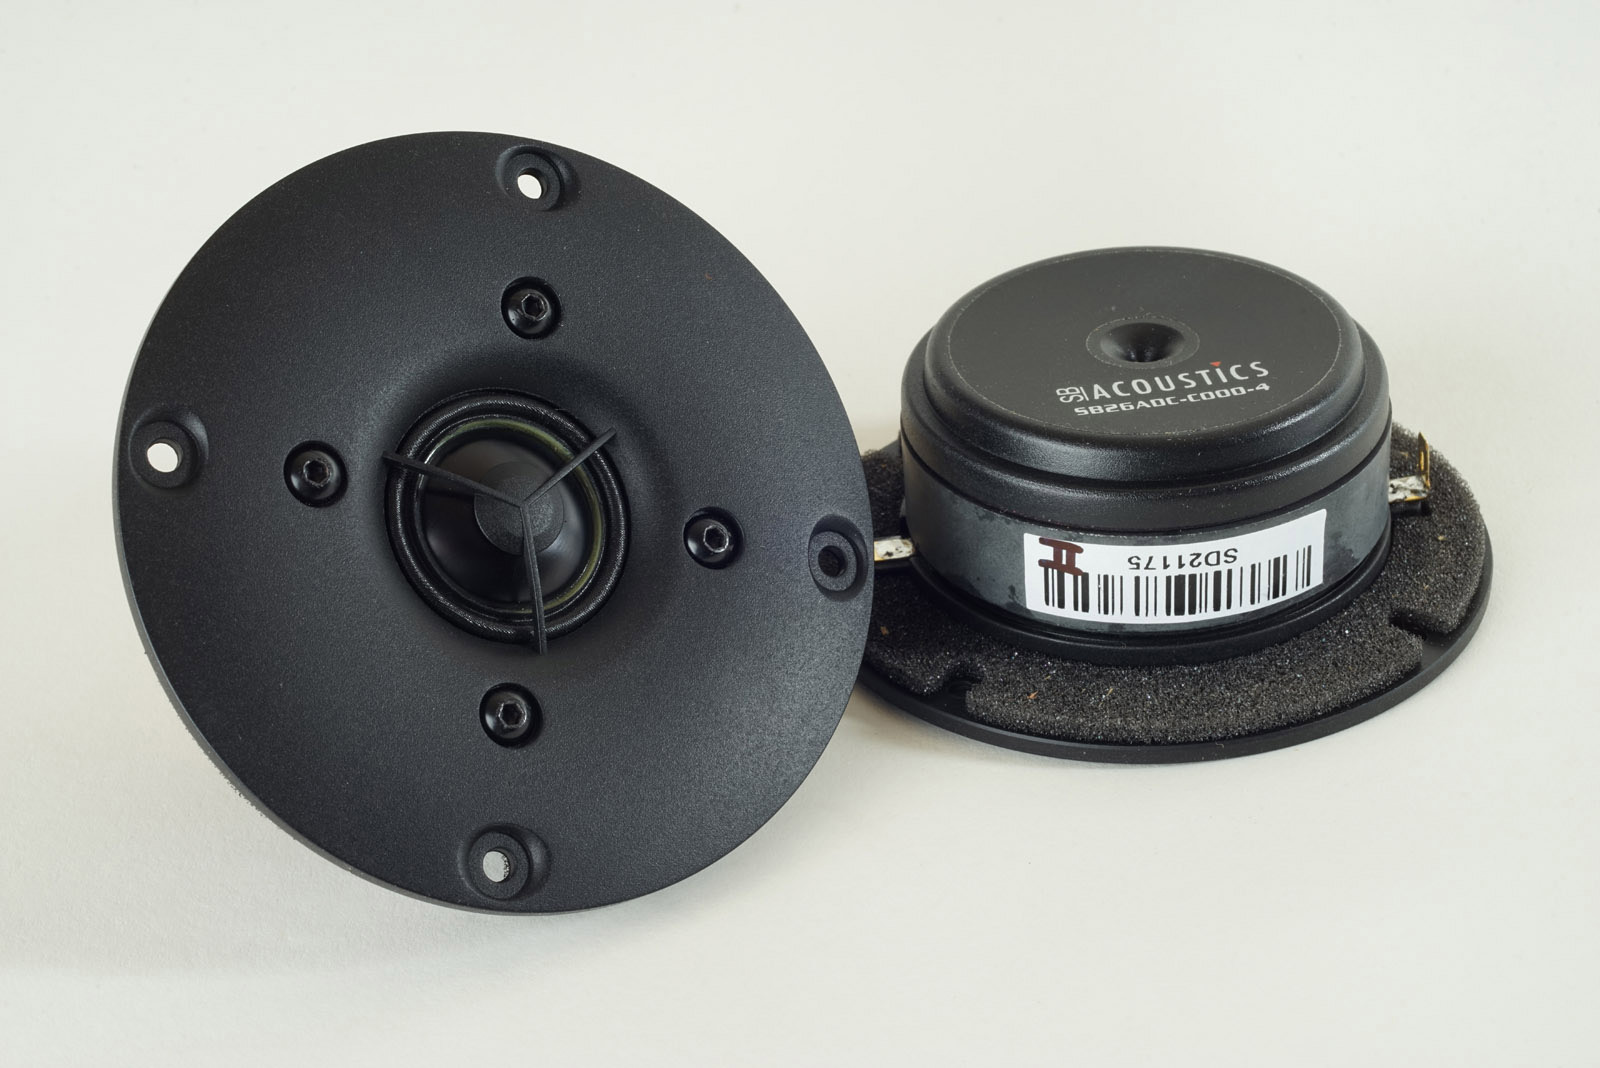
2-way 16 liter speaker from 6" mid-bass and 1" dome tweeter.
System sensitivity: 85 dB.
Impedance: 8 Ohms.
Point of crossover: 2000 Hz, LR4 (forth order) topology.
Power handling: 60 watts, and please read here: http://www.troelsgravesen.dk/power-handling.htm. Any burned driver is a misused driver!
Click images to view large
Download data sheets here: SB17NRXC35-8 SB26ADC-C000-4
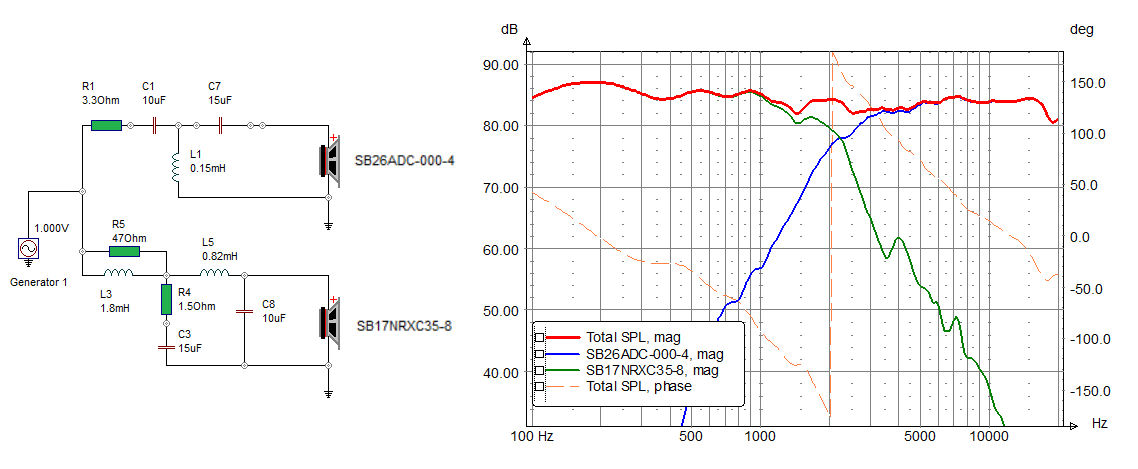
Above the LR4 crossover - almost as simple as it gets.
To the right simulated response from drivers and summed
response.
Point of crossover ~2000 Hz.
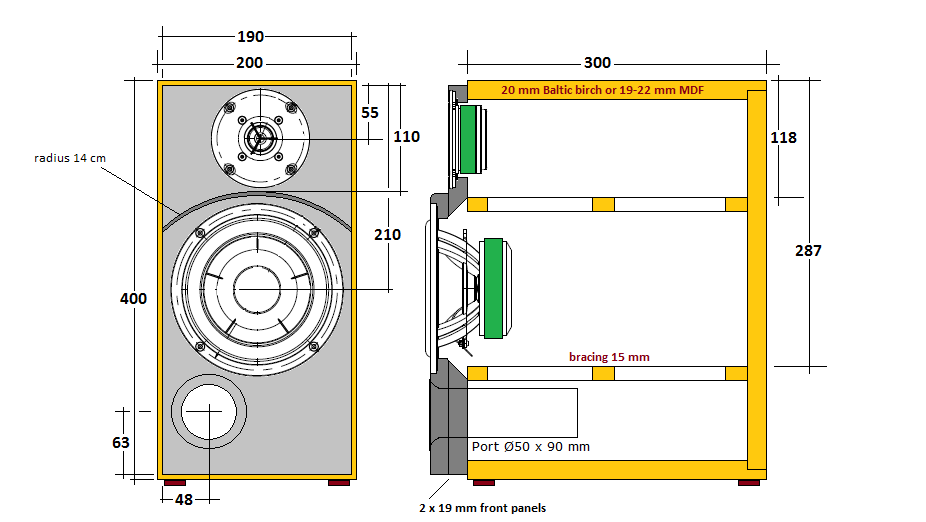
Net volume is 16 litres from 20 mm panel thickness.
Keep external dimensions regardless panel thickness.
16 mm MDF can be used for bracing.
Go to SBA-61-NAC for cabinet details and construction.
Everything that can be counted does not necessarily count; everything that counts cannot necessarily be counted". Albert Einstein.
A few comments on MEASUREMENTS before you start
interpreting all the readings below.
First of all, if we think measurements will tell us how a speaker
sounds, we're wrong. The perception of sound is way too subjective to be
reflected in any measurements we can perform. A loudspeaker system is
meant to give us a satisfying idea of an acoustic event and for some
people a pair of 5 USD ear-plugs are enough, others spend 200 kUSD on a
truly full-range pair of speakers - and the latter may not be happier
than the former.
Above you see the same graph presented with the
same 50 dB scaling, but at
different width and height. Now, we may think the graph to the right looks rather
rugged, but if we stretch out the presentation (left) it suddenly looks
rather smooth. The left presentation is often used by driver manufacturers to make their frequency response graphs look better. If we
apply e.g. 1/6 or 1/3 octave smoothing things look even better. Just
this to display how easily measurements can be manipulated to look nice.
Measurements may give us an idea of tonal balance of a system, i.e. too
much or too little energy in certain areas. Measurements may tell us
about bass extension if far-field measurements are merged with
near-field measurements. In addition to this, ports may contribute to
bass extension. Most of us diy'ers do not have access to an anechoic
room for full-range measurements from 20-20000 Hz, nor do manufacturers
for that matter.
Some further info here on commercial speakers:
http://www.troelsgravesen.dk/Stereophile.htm. If I ever made a
speaker displaying such un-linear response, no one would probably ever
build it.
What cannot be seen is what kind of bass performance we get in a given
room. Bass performance is highly dependent on in-room placement of your
speaker and the same speaker can be boomy in one place and lean in
another.
Actual SPL level at 1 meter distance and 2.8V input is useful for en
estimate of system sensitivity and combined with the impedance profile
may give an idea of how powerful an amplifier is needed to drive the
speaker to adequate levels.
What measurements do not tell is the very sound of the speaker unless
displaying serious linear distortion. The level of transparency, the
ability to resolve micro-details, the "speed" of the bass, etc., cannot
be derived from these data. Distortion measurements rarely tell much
unless seriously bad, and most modern drivers display low distortion
within their specified operating range.
Many people put way too much into these graphs and my comments here are
only meant as warning against over-interpretation. There are more to
good sound than what can be extracted from a few graphs. Every graph
needs interpretation in terms of what it means sonically and how it
impacts our choice of mating drivers, cabinet and crossover design.
What measurements certainly do not tell is the sonic signature of the
drivers, because cones made from polyprop, alu, Kevlar, paper, glass
fiber, carbon fiber, magnesium, ceramics or even diamonds all have their
way of colouring the sound.
The choice of crossover topology has a huge impact on the sound
we get. We may produce the same frequency response from 1st, 2nd or 4th
order filters and they may be Butterworth, Linkwitz-Riley, Bessel and
others and they all sound different, very different indeed, so take
care!
SBA 61-NRXC MEASUREMENTS
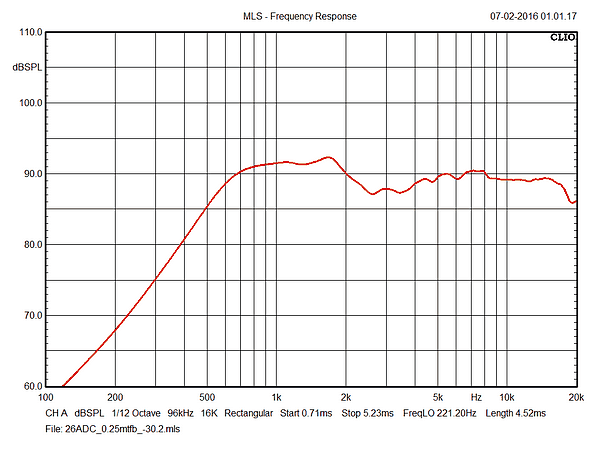
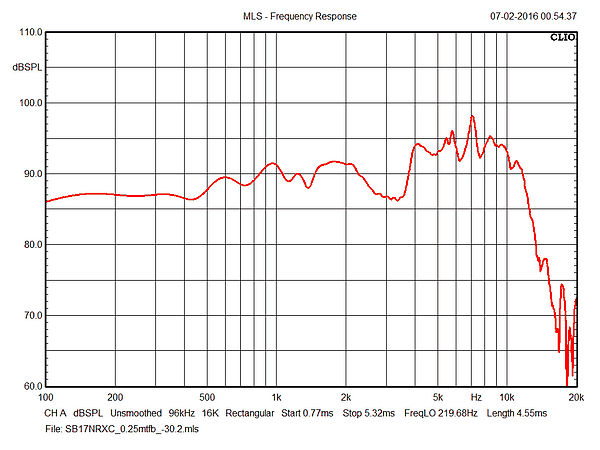
Left: Tweeter response in cabinet, no crossover. Right: Midbass response
in cabinet, no crossover.
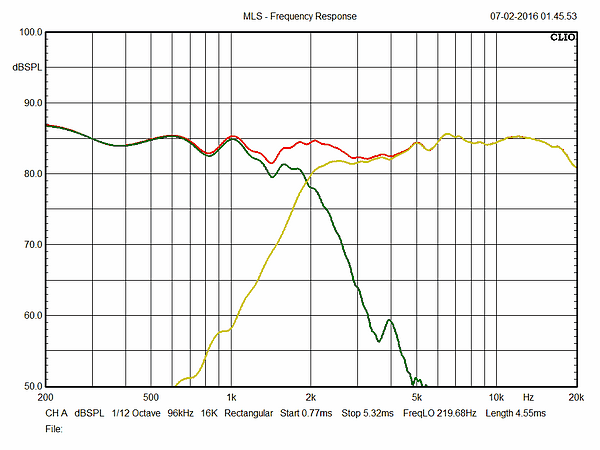
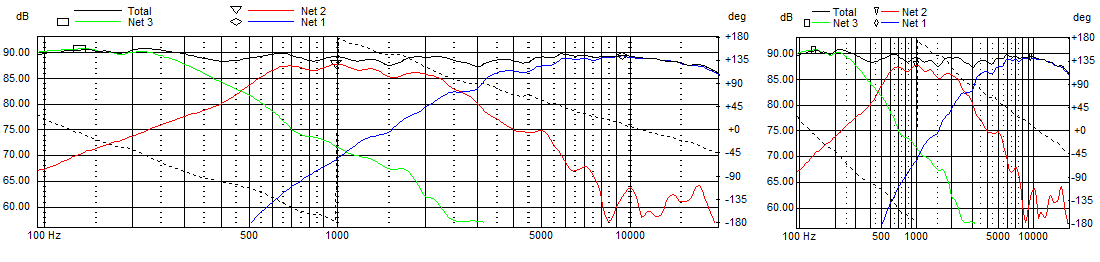
Left:
Response of individual drivers driven from crossover and summed
response (red). Point of crossover around 2000 Hz.
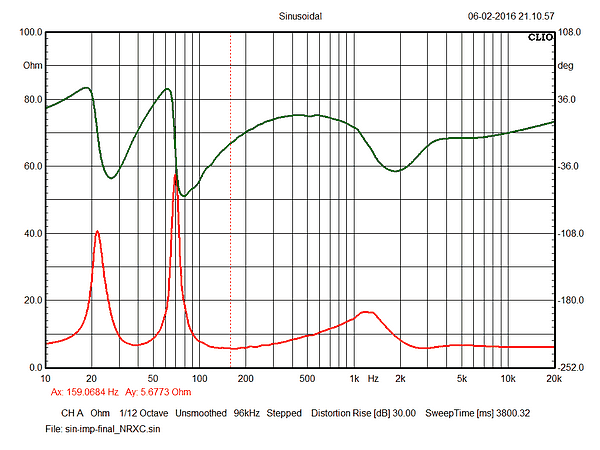
Right: Final system impedance. Minimum impedance = 5.7 Ohm.
Suggested parts list
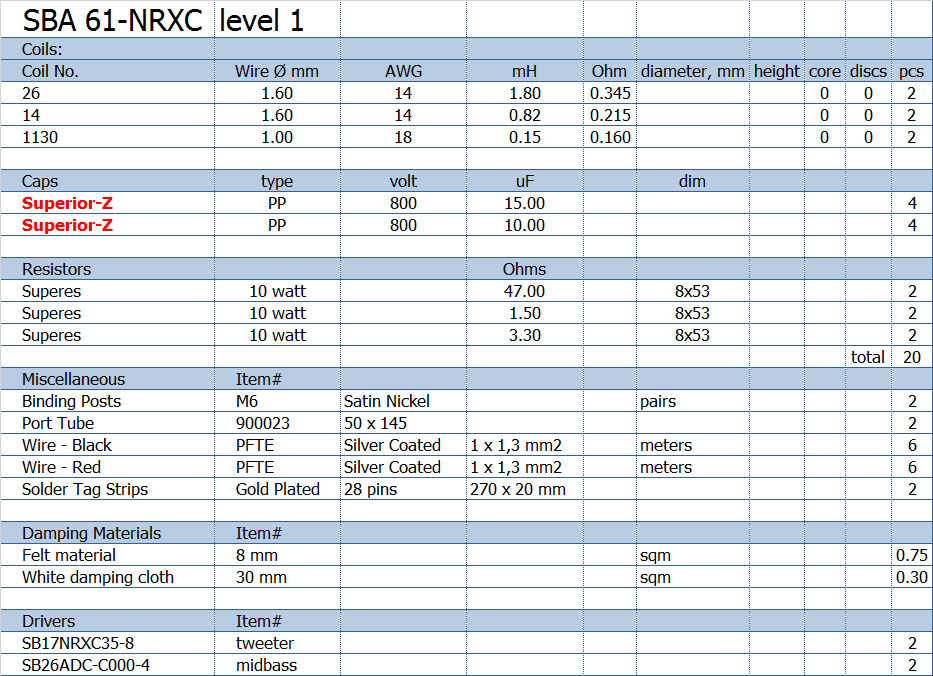
Here you can see the required DCR of coils. Can be +/- 0.1 Ohm.
CROSSOVER-LAYOUT
BACK TO INDEX
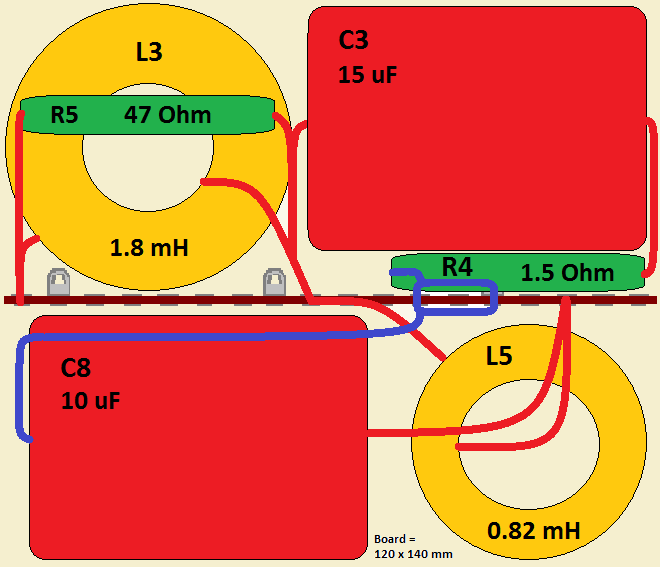
Bass section layout, level 1

Tweeter section layout, level 1
For level 2, the Superior-Z caps (C3 and C8) are replaced with STANDARD-Z caps. No other changes.
For level 3, all caps are STANDARD-Z caps.
WIRING
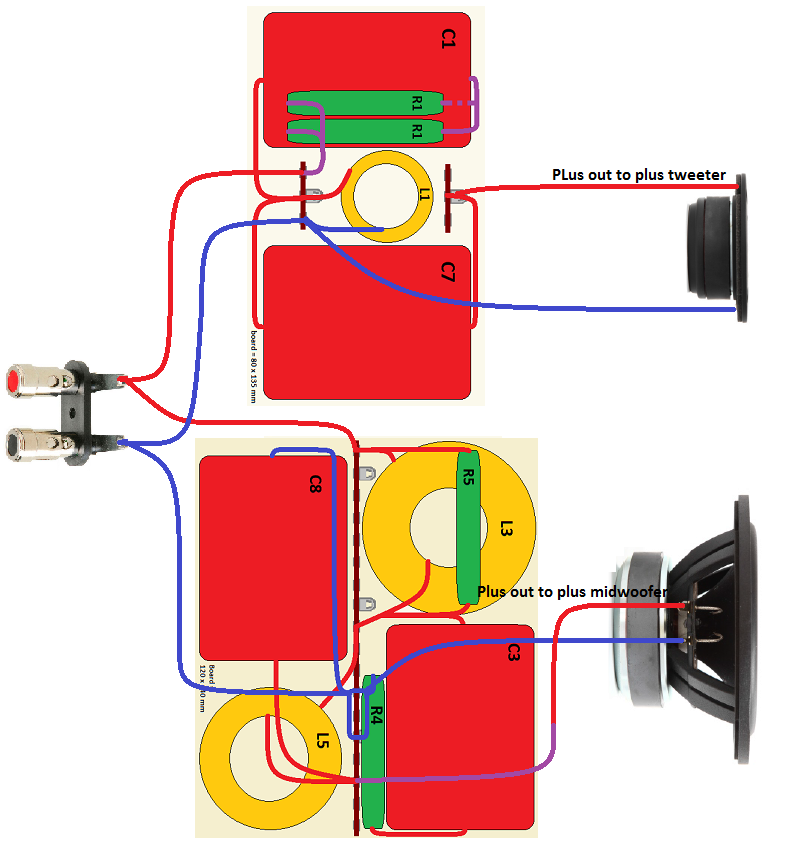
Speaker wiring. Both drivers connected with positive polarity.